Pivot Table Tutorial
The following tutorials are intended to help those not familiar with Excel to produce tables that will help summarize your data. For example, they can be used to help determine how many children have been assessed with a measure and how many times a measure has been completed for that child. These tables are called Pivot Tables and are features in Excel for both Windows and Mac users. A pivot table is a tool in Excel which summarizes selected columns and rows of data in a spreadsheet to obtain a desired report. The tool does not actually change the spreadsheet or data itself, it simply “pivots” or turns the data to view it from different perspectives. This particular tutorial provides instructions on how to complete the following:
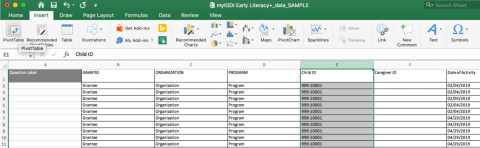
- Create a pivot table and utilize additional formulas to count the actual number of children assessed with myIGDIs Literacy+ data exported from DAISEY.
- Get an idea of how many children had the required number of repeated measures.
- Get a more detailed breakdown of what subtests by season have been entered into DAISEY for each child.
As previously stated, the example utilizes myIGDIs Literacy+ data exported from DAISEY. However, the steps could also be applied to myIGDIs Numeracy data and other common measures data exported from DAISEY. Please keep in mind WSU will still clean the data to remove duplicates or data errors during analysis for KCCTF evaluation.